Working with images in Python#
# install pillow with: pip install pillow
from PIL import Image
import numpy as np
# opening the image and converting it to a numpy array
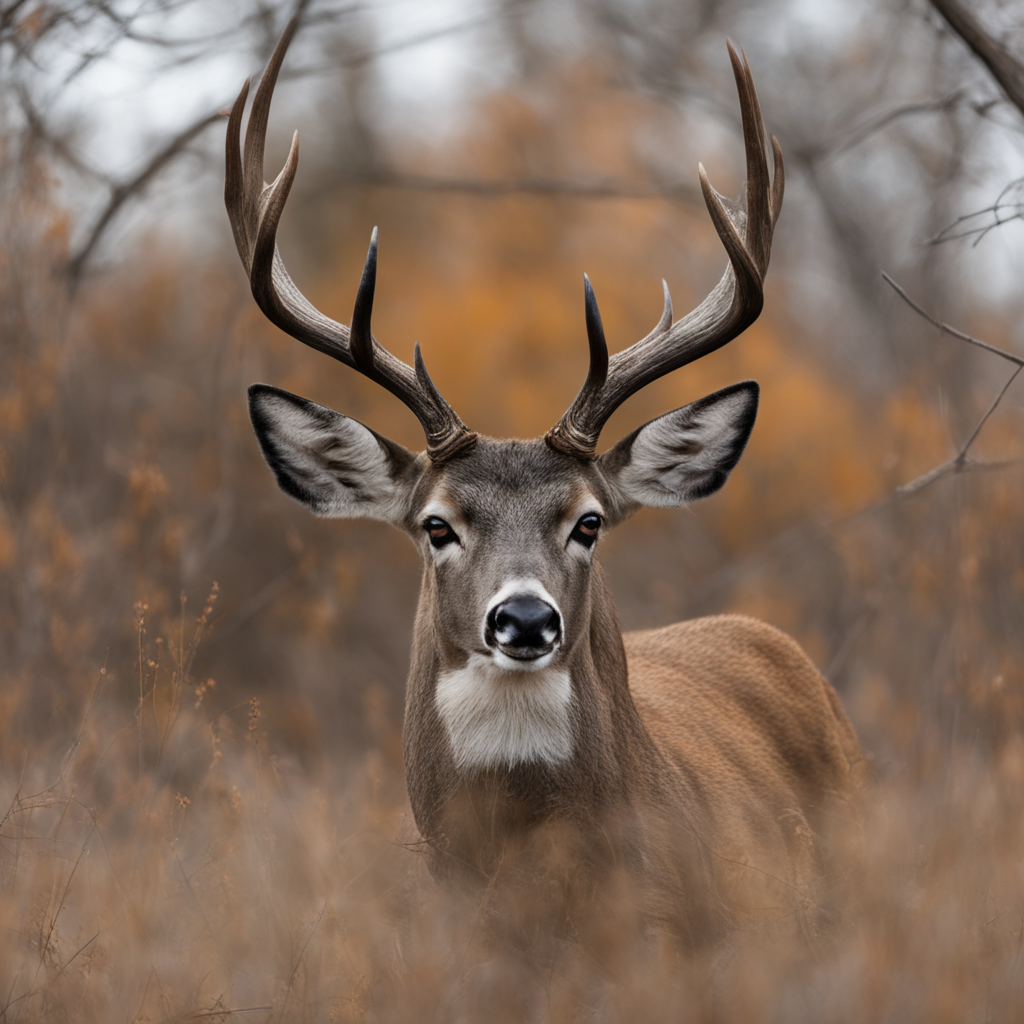
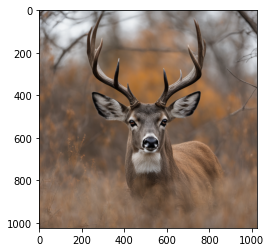
img = Image.open('./images/deer.png')
img
# images are stored as numpy arrays
img_array = np.array(img)
img_array
array([[[119, 117, 117],
        [126, 124, 125],
        [131, 129, 129],
        ...,
        [164, 165, 167],
        [166, 165, 168],
        [168, 166, 169]],

       [[118, 116, 116],
        [125, 123, 123],
        [128, 123, 125],
        ...,
        [165, 165, 168],
        [169, 168, 170],
        [170, 168, 170]],

       [[112, 109, 111],
        [119, 116, 117],
        [127, 123, 126],
        ...,
        [168, 168, 171],
        [169, 169, 172],
        [170, 170, 173]],

       ...,

       [[103,  83,  69],
        [104,  84,  68],
        [101,  78,  65],
        ...,
        [117,  88,  67],
        [116,  89,  66],
        [117,  89,  66]],

       [[105,  83,  69],
        [104,  83,  69],
        [103,  80,  67],
        ...,
        [116,  87,  66],
        [116,  88,  66],
        [116,  88,  65]],

       [[ 98,  77,  62],
        [100,  79,  65],
        [102,  80,  66],
        ...,
        [117,  88,  66],
        [115,  87,  66],
        [116,  87,  65]]], dtype=uint8)
What is the shape of the array? What do the dimensions mean?
img_array.shape
(1024, 1024, 3)
An explanation of the dimensions of an image array:
The first dimension is the height of the image (in pixels).
The second dimension is the width of the image (in pixels).
The third dimension is the number of channels in the image. An RGB image has three channels (red, green, and blue)
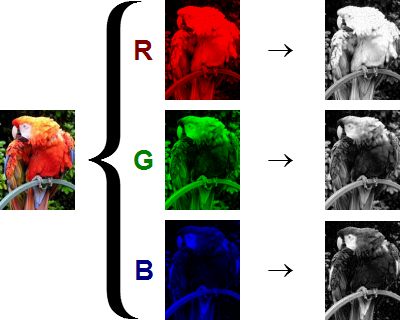
So each cell in the array represents a pixel value of each basic color (R, G or B).
What are the ranges of the pixel values?
img_array.max()
246
img_array.min()
0
The range of the pixel values is from 0 to 255. 0 means no color (black) and 255 means full color (white).
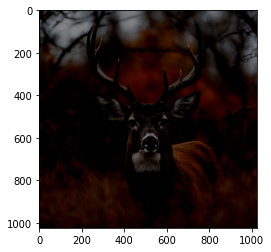
Substract the mean of the image from each pixel. What happens to the image?
Make sure to avoid values outside the range 0-255 after the operation.
mean = img_array.mean()
img_no_mean = img_array - mean

img_no_mean[img_no_mean < 0] = 0
img_no_mean[img_no_mean > 255] = 255
img_no_mean = img_no_mean.astype(np.uint8)
import matplotlib.pyplot as plt

# function to plot images
plt.imshow(img_no_mean)
<matplotlib.image.AxesImage at 0x10a821a00>
plt.imshow(img_array)
<matplotlib.image.AxesImage at 0x10a93a400>
Blending two images together! ⚗️#
Since images are arrays, we perform any operation over them, like adding, substracting, multiplying, etc.
Let’s compute the average of two images:
image1 = Image.open('images/deer.png')
image1_arr = np.array(image1)
image2 = Image.open('images/clock.png')
image2
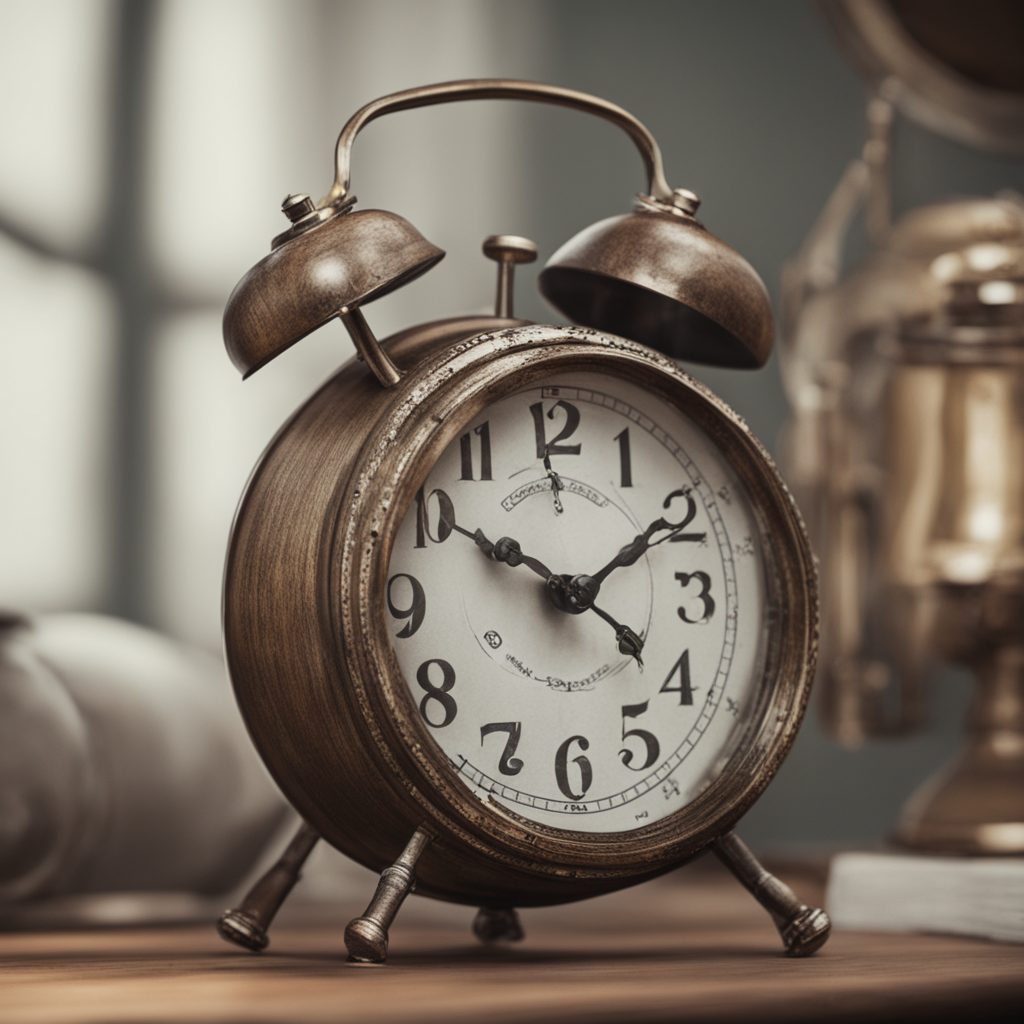
image2_arr = np.array(image2)
image2_arr.shape
(1024, 1024, 3)
We compute the average of two vectors as
image_blend = 0.8 * image1_arr + 0.2 * image2_arr
# Remember to clip pixel values to between 0 and 255
image_blend[image_blend < 0] = 0
image_blend[image_blend > 255] = 255
image_blend = image_blend.astype(np.uint8)  # convert to integers

plt.imshow(image_blend)
<matplotlib.image.AxesImage at 0x10aa23430>
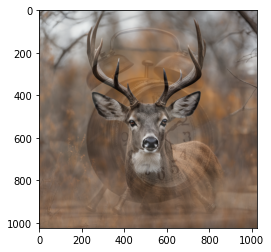
That was the result of blending two images together, in the pixel vector space.
It’s not very pretty right? Let’s try something else.
#!pip install replicate

import replicate
import os

os.environ['REPLICATE_API_TOKEN'] = 'r8_...api_here...'
def plot_two_images_side_by_side(image1_path, image2_path):
    image1 = Image.open(image1_path)
    image2 = Image.open(image2_path)
    image1_arr = np.array(image1)
    image2_arr = np.array(image2)

    fig, axs = plt.subplots(1, 2)
    axs[0].imshow(image1_arr)
    axs[0].axis('off')
    axs[1].imshow(image2_arr)
    axs[1].axis('off')
    plt.show()
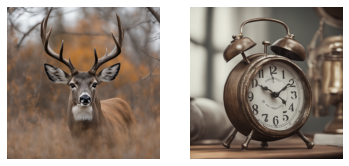
image1_path = 'images/deer.png'
image2_path = 'images/clock.png'

plot_two_images_side_by_side(image1_path, image2_path)
deployment = replicate.deployments.get("vicgalle/image-blending")
prediction = deployment.predictions.create(
  input={"image1": open("images/deer.png", "rb"),
         "image2": open("images/clock.png", "rb"),
         "prompt": ""}
)
prediction.wait()
print(prediction.output)
https://replicate.delivery/pbxt/d9Hw4ntgVT6UBR2nYRgUfzNIxQloM2k3eyCLqDfffl9Nz4dRC/output.png
import requests
Image.open(requests.get(prediction.output, stream=True).raw)
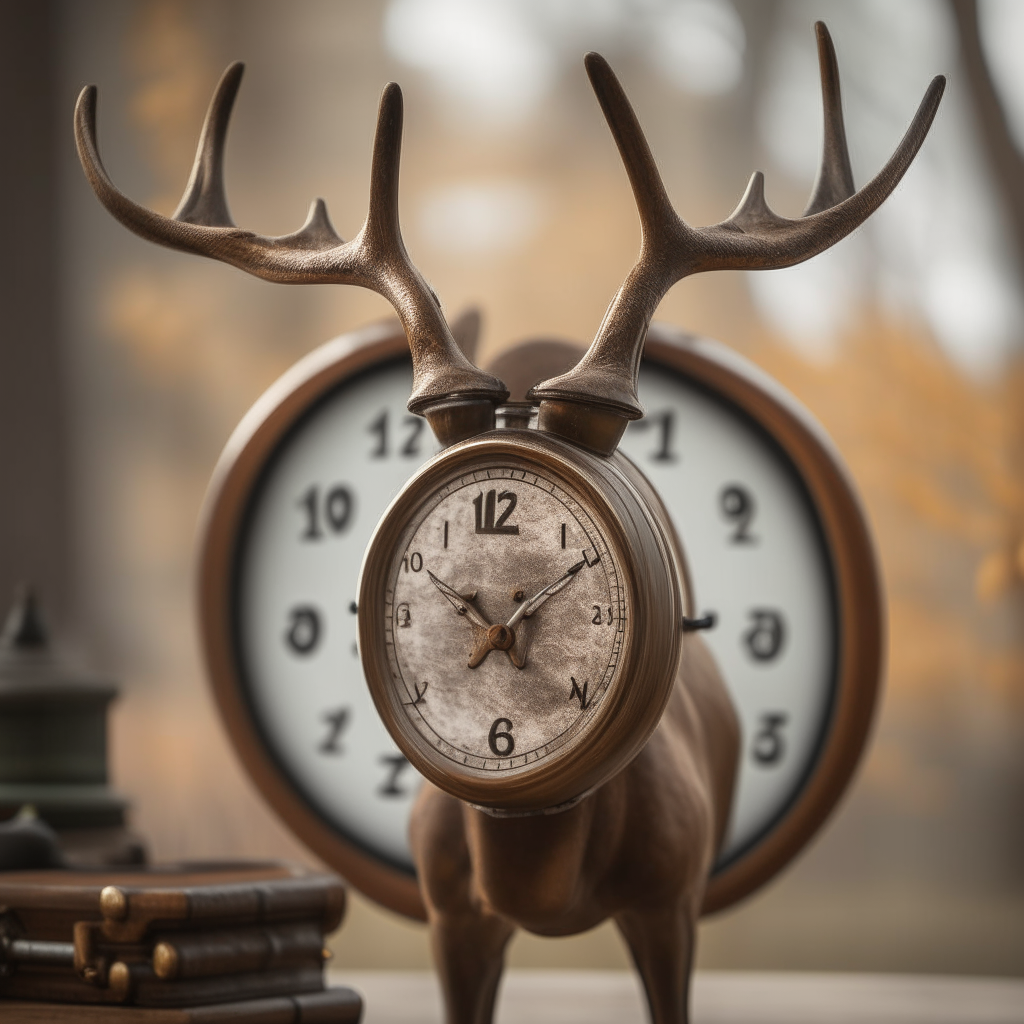
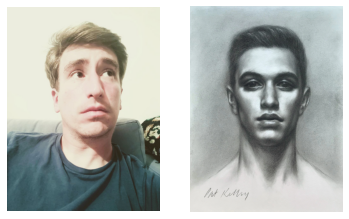
image1_path = "images/vic.JPG"
image2_path = "images/portrait.png"

plot_two_images_side_by_side(image1_path, image2_path)
deployment = replicate.deployments.get("vicgalle/image-blending")
prediction = deployment.predictions.create(
  input={"image1": open("images/vic.JPG", "rb"),
         "image2": open("images/portrait.png", "rb"),
         "prompt": ""}
)
prediction.wait()
print(prediction.output)
https://replicate.delivery/pbxt/tbgEclwXRSbrNJIzzMeDPkygQzE1hhcJKKDCQsWgSnuAa2FJA/output.png
Image.open(requests.get(prediction.output, stream=True).raw)
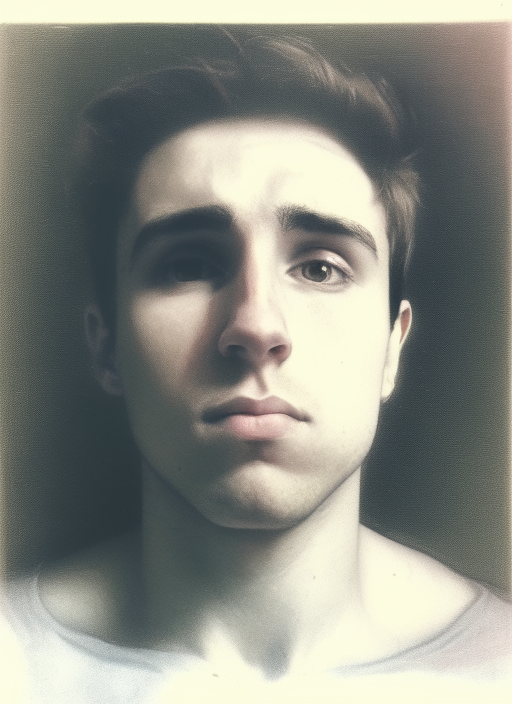
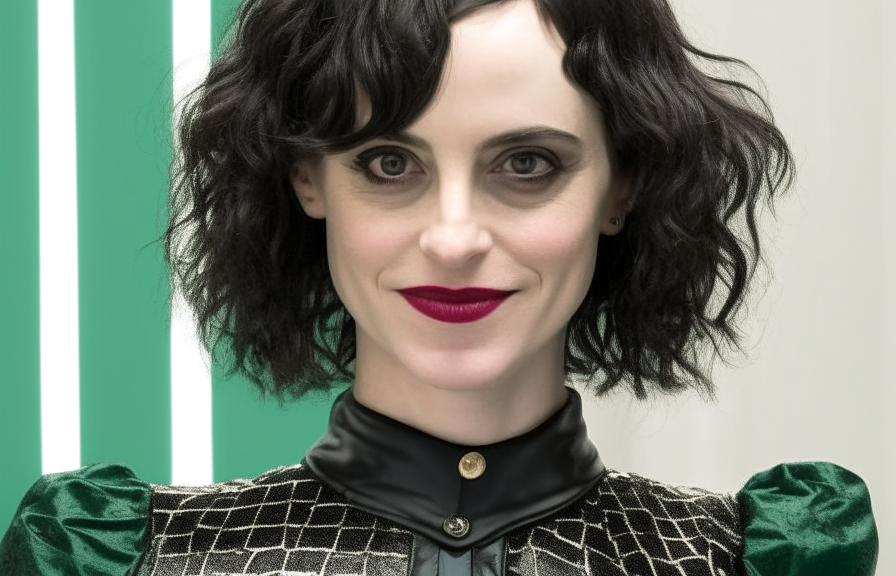
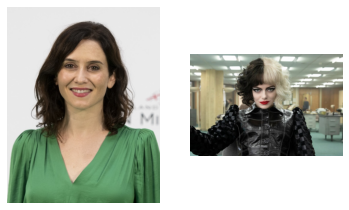
image1_path = "images/ayuso.jpg"
image2_path = "images/cruella.jpeg"

plot_two_images_side_by_side(image1_path, image2_path)
deployment = replicate.deployments.get("vicgalle/image-blending")
prediction = deployment.predictions.create(
  input={"image1": open(image1_path, "rb"),
         "image2": open(image2_path, "rb"),
         "prompt": ""}
)
prediction.wait()
print(prediction.output)
https://replicate.delivery/pbxt/lEgCRszhKnKXOBw3OgZVO1yzZNg9TQCBCGKDKwqB6rZdN7iE/output.png
Image.open(requests.get(prediction.output, stream=True).raw)